

ANS Explorer · Next generation

Your measurement.
A report you can understand.

ANS Explorer combines analysis of your heartbeat intervals with a personal explanation and a clear view of changes over time. It shows more than individual values: how the results relate to each other and the conditions in which they were recorded.

View editions ↓
  1. 01

    Measure

    A supported recording device captures your heartbeat intervals. Recording conditions provide the context for analysis.

  2. 02

    Understand

    Your report connects the interpretation of the recording with clear explanations, charts and information on data quality.

  3. 03

    Compare

    Explore multiple recordings over time, taking posture, breathing and quality into account.

HRV analysis with NEUROCOR® precisionHRV connects our own analytical technology with a traceable workflow: from recording and quality review to interpreting results.

Different measurements. Individual explanations.

The personal report adapts its focus to each measurement. Choose an example to see how the result is interpreted.

ANS status diagram
Autonomic regulation
highmediumlow
Original NEUROCOR colour field of the ANS status diagram. The blue marker shows this example’s position.
RecoverybalancedActivation

Example A

Good autonomic regulation

A balanced interplay.

In the ANS model, good regulation together with a balanced autonomic profile indicates a favorable regulatory state.

How the personal report explains the result

Your measurement shows favorable current autonomic regulatory fitness: your heart rate varies noticeably, and rapid beat-to-beat regulation is also preserved. This is consistent with active fine-tuning of heart rate, breathing and circulation. […] Use this result as a starting point for further measurements under comparable conditions.

Excerpt from the personal regulation report · editorial translation

Further charts and explanations for this example
Beat sequence and data quality
Next interval (ms)
1,5001,200900600300
Original Poincaré plot from this recording with a broader regular distribution. Both axes show 300 to 1,500 ms.
3006009001,2001,500

359 intervals · no artefacts detected · approximately 334 seconds examined.

The strength of the individual components
FFT-Power (ms²)
VLFLFHF
798.1598.6399.1199.50
Original spectrum from this recording, 0 to 0.4 Hz. FFT power up to 798.1 ms²; total power 3,922.8 ms².
00.10.20.30.4

LF 939.1 ms² · HF 681.5 ms² · LF/HF 1.4

Regulatory capacity and autonomic balance describe different aspects of the same regulatory state. Their interaction provides a meaningful overall picture.

The Poincaré axes run from 300 to 1,500 ms. The spectrum shows 0 to 0.4 Hz; the power scale for this example extends to 798.1 ms². The spectra in examples A and B use different power scales. Check the axis values when switching between them.

ANS status diagram
Autonomic regulation
highmediumlow
Original NEUROCOR colour field of the ANS status diagram. The blue marker shows this example’s position.
RecoverybalancedActivation

Example B

Markedly limited regulation

Low regulation. Shifted balance.

Autonomic regulation is markedly limited. In this example, the balance also shifts toward activation.

How the personal report explains the result

Your measurement shows little overall autonomic modulation: your heart rate varies only slightly, both across several beats and from one beat to the next. […] Within the ANS model, this low level suggests less capacity for autonomic adaptation in this situation. […] A repeatedly low profile should be taken seriously from a health perspective. […] If the profile remains unfavorable, discuss possible causes and risk factors with your doctor, including blood pressure, metabolism and medication.

Excerpt from the personal regulation report · editorial translation

Further charts and explanations for this example
Beat sequence and data quality
Next interval (ms)
1,5001,200900600300
Poincaré plot with a narrow, compact distribution around 800 ms. Both axes show 300 to 1,500 ms.
3006009001,2001,500

400 intervals · no artefacts detected · approximately 320 seconds examined.

The strength of the individual components
FFT-Power (ms²)
VLFLFHF
90.467.845.222.60
Spectrum with low total power of 181.9 ms² and a clear predominance of slower components. Frequencies from 0 to 0.4 Hz.
00.10.20.30.4

LF 140.6 ms² · HF 16.0 ms² · LF/HF 8.8

Regulatory capacity and autonomic balance describe different aspects of the same regulatory state. Their interaction provides a meaningful overall picture.

The Poincaré axes run from 300 to 1,500 ms. The spectrum shows 0 to 0.4 Hz; the power scale for this example extends to 90.4 ms². The spectra in examples A and B use different power scales. Check the axis values when switching between them.

Heart rhythm diagram
Next interval (ms)

Red: flagged irregularities

Example C

Unusual beat sequence

Check the beat sequence first.

Here, the unusual beat intervals take priority. The interpretation therefore starts with the heart rhythm diagram.

How the personal report explains the result

High variability can result from measurement errors or irregular beats and must not be taken as good regulatory fitness here. […] In the evaluable segments, adjacent beat intervals show little similarity; the points are widely scattered. Irregular rhythms, extra beats and recording errors are possible explanations. […] Repeat the measurement with careful sensor contact and as little movement as possible. […] If unusual beat sequences persist or you notice palpitations, have your heart rhythm checked by a doctor.

Excerpt from the personal regulation report · editorial translation

Further charts and explanations for this example
ANS status diagram
Autonomic regulation
highmediumlow
Original NEUROCOR colour field of the ANS status diagram. The blue marker shows this example’s position. Limited interpretability
RecoverybalancedActivation

Artefact warningArtefact load 12.7% · threshold 5.0%

The original value exceeds the visible range. The point is therefore shown at the upper edge of the chart.

A high point alone is not enough.

For this measurement, the report still shows the calculated status position — together with the artefact warning and limited interpretability.

Your overall variability SDRR is 116.2 ms. In the status model, this corresponds mathematically to the “good regulatory capacity” range; on the “Autonomic balance” axis, the result lies to the left. Here, this position is a mathematical description. The limitations described do not allow an unrestricted interpretation as autonomic regulatory fitness.

Excerpt from the personal regulation report · editorial translation

Measurement quality and markers

369 intervals · 47 correction markers · quality threshold exceeded. The cause of the unusual beat sequence remains unresolved.

  • Beat intervals
  • Reconstructed
  • Flagged irregularities
DiagramThe same excerpt in a larger view

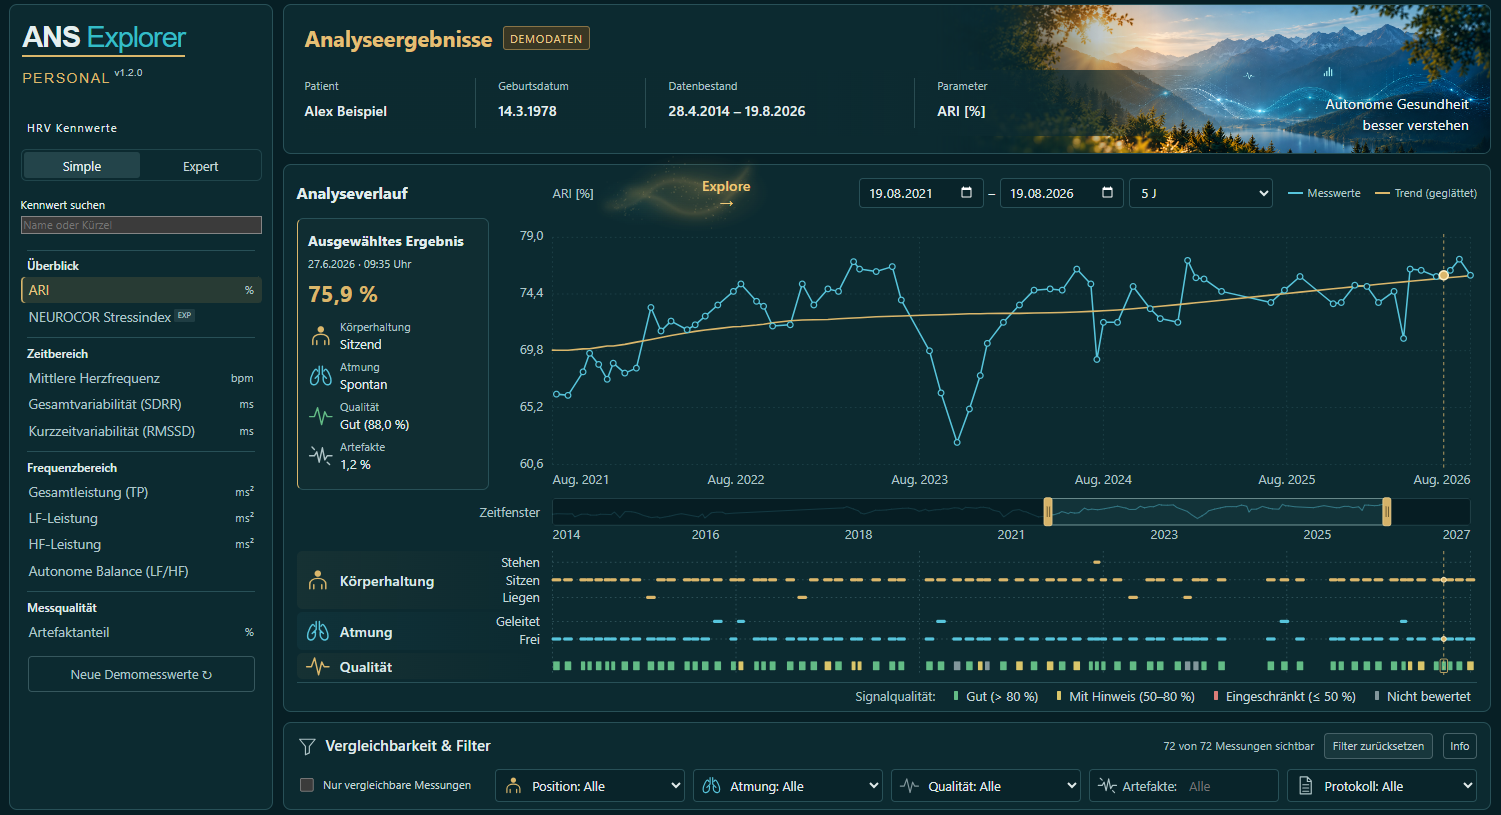
The next step: changes over time

How do my values change?

A history becomes more informative when recording conditions remain visible. The original screen shows posture, breathing and quality alongside the values, with filters for selecting recordings.

ANS Explorer: original standard view with measurement history, posture, breathing, quality and comparability. Example view.
Original ANS Explorer interface · example viewHistory · context · quality · comparability
ANS Explorer Original size · scroll to explore
Original software view with example view at full resolution
01

HistoryRecordings over longer periods rather than an isolated number.

02

ContextPosture, breathing and signal quality stay linked to each recording.

03

ComparabilityFilters help you compare recordings from similar situations.

The next ANS Explorer generation

The right access for your needs.

Personal for you and your family. Medical for professional and commercial use. The full feature comparison, prices and allowances are available in ANS Explorer.

Personal and Medical use the NEUROCOR® precisionHRV algorithm with 31 HRV metrics. The editions differ in their permitted use, recording options and management features.

Personal – Parameters, charts & features

Technical overview · scroll vertically

Calculated metrics

Time domain · 7 metrics

SDRRStandard deviation of RR intervals
ms
RMSSDRoot mean square of successive RR differences
ms
NN50Number of successive RR differences exceeding 50 ms
count
pNN50Proportion of successive RR differences exceeding 50 ms
%
CVCoefficient of variation of RR intervals
%SDRR relative to mean RR, scaled by 100.
MASDMean absolute successive RR difference
msAlso called absolute sinus arrhythmia; counted once.
rRRLag-1 correlation of successive RR intervals
dimensionless

Frequency domain · 18 metrics

Peak frequencies identify band maxima; they are not directly measured respiratory rates.

VLFVLF band power
ms²
LFLF band power
ms²
HFHF band power
ms²
TPTotal power according to the analysis profile
ms²Summed over defined bands or the full spectrum, according to the profile.
VLF %Relative VLF power
%
LF %Relative LF power
%
HF %Relative HF power
%
LFnuNormalised LF power
n.u. (0–100)Reference power: total power minus VLF.
HFnuNormalised HF power
n.u. (0–100)Reference power: total power minus VLF.
LF/HFLF-to-HF power ratio
dimensionless
VLF peak fVLF peak frequency
Hz
LF peak fLF peak frequency
Hz
HF peak fHF peak frequency
Hz
VLF peak AVLF peak amplitude
sIn the Expert web report; not selectable as a trend parameter. The spectrum chart can display amplitudes in ms.
LF peak ALF peak amplitude
sIn the Expert web report; not selectable as a trend parameter. The spectrum chart can display amplitudes in ms.
HF peak AHF peak amplitude
sIn the Expert web report; not selectable as a trend parameter. The spectrum chart can display amplitudes in ms.
SESpectral entropy using the implemented legacy method
method-specific; no unit specifiedUses unnormalised spectral power values in s² and the base-10 logarithm; neither sample entropy nor normalised Shannon entropy.
HCRHeart Coherence Ratio
dimensionlessRatio using the implemented method, based on a peak window and the remaining spectral power.

Geometric methods · 6 metrics

SD1Poincaré short-axis standard deviation
ms
SD2Poincaré long-axis standard deviation
ms
SD1/SD2Poincaré SD1/SD2 ratio
dimensionless
APoincaré ellipse area
ms²
TAITriangular index
dimensionlessRatio of interval count to the frequency of the modal bin.
TINNTINN using the implemented legacy method
msIn the Expert web report; not selectable as a trend parameter. A geometric overlay is not available for every result.

The following metrics belong to the shared calculation core. They are accessible in the Expert view of the detailed web report for BLE RR and context-bound ATF recordings. The 31 main metrics are also available as trend parameters, with the explicitly marked exceptions of TINN and peak amplitudes. PDF profiles have their own output scope.

The 31 HRV metrics include derived measures. Transformations, reference percentiles, quality information, individual histogram bins and spectral points are not counted as additional metrics. Availability of individual values depends on the data source, analysis profile and usable recording.

Mathematically undefined or unusable measures remain unavailable; they are not replaced with zero. SDRR is not counted again as SDNN.

Four base measures and regulation index

Additional to the 31 HRV metrics; also selectable as trend parameters when results are available.

RR meanMean RR interval
ms
RR minMinimum RR interval
ms
RR maxMaximum RR interval
ms
HR meanMean heart rate
bpmCalculated as 60000 / mean RR interval in ms.
ARIAutonomic Regulation Index
% (index 0–100)Composite regulation index, not a percentage of health or a probability of disease.

Logarithmic outputs

Expert web report and selectable trend parameters, when a value is available for the recording.

ln(LF)Natural logarithm of LF power
no unitLogarithm of the numerical value in ms²; requires positive power.
ln(HF)Natural logarithm of HF power
no unitLogarithm of the numerical value in ms²; requires positive power.
ln(LF/HF)Natural logarithm of the LF/HF ratio
dimensionlessRequires a positive, defined ratio.

Reference percentiles · 16 outputs

Assigned to their respective metric in the Expert web report when a sufficient matching reference group exists. These are neither additional HRV metrics nor separately selectable trend curves. PDF outputs use their own profile selection.

PR VLFReference percentile for VLF band power
percentile (0–100)
PR LFReference percentile for LF band power
percentile (0–100)
PR HFReference percentile for HF band power
percentile (0–100)
PR VLF %Reference percentile for relative VLF power
percentile (0–100)
PR LF %Reference percentile for relative LF power
percentile (0–100)
PR HF %Reference percentile for relative HF power
percentile (0–100)
PR LFnuReference percentile for normalised LF power
percentile (0–100)
PR HFnuReference percentile for normalised HF power
percentile (0–100)
PR TPReference percentile for total power
percentile (0–100)
PR LF/HFReference percentile for LF/HF ratio
percentile (0–100)
PR RR meanReference percentile for mean RR interval
percentile (0–100)
PR HR meanReference percentile for mean heart rate
percentile (0–100)
PR SDRRReference percentile for SDRR
percentile (0–100)
PR RMSSDReference percentile for RMSSD
percentile (0–100)
PR ln(LF/HF)Reference percentile for ln(LF/HF)
percentile (0–100)
PR ARIReference percentile for ARI
percentile (0–100)

Analysis profile and histogram details

Additional Expert web report outputs describing the profile and histogram; not separate trend parameters.

VLF startLower evaluated VLF frequency
Hz
VLF endUpper evaluated VLF frequency
Hz
LF startLower evaluated LF frequency
Hz
LF endUpper evaluated LF frequency
Hz
HF startLower evaluated HF frequency
Hz
HF endUpper evaluated HF frequency
Hz
N unassignedIntervals not assigned to legacy histogram bins
count
N modalFrequency of the modal legacy histogram bin
count

Recording duration, processing and quality

Available according to the recording route in result quality, the RR view and the detailed web report. Protocol duration, the signal quality index and the heart-rate check belong to the detailed web report. Not every supplementary value is a trend parameter.

T recordingActual interval coverage of the original recording
s
T analysisDuration of the analysed RR series
ms
T protocolNominal protocol duration
sSeparate from the actual recording duration.
N inputInput interval count
count
N analysisAnalysis interval count
count
N markedIntervals marked for processing
countMarked intervals are not necessarily values that were actually changed.
N modifiedInterval values actually modified
countIn the comparison of original and analysis series.
AFBProportion marked for correction
%Also available as a trend quality measure; not a confirmed error or rhythm diagnosis.
AFB limitApplied artefact warning threshold
%
QualityTechnical signal quality index
%Technical assessment; not the proportion of correctly measured heartbeats.
N fastNumber of fast intervals in the heart-rate check
count
Fast %Proportion of fast intervals in the heart-rate check
%
N checkedInterval count used for the heart-rate check
count
Artefact method and processing applied
description / statusProcessing information provided with the result, not a manual beat or artefact editor.
Quality warnings and suppressed interpretation
status / noticeIndicates when data quality limits the interpretative output.

Respiratory heuristic check values

Supplementary check values in the Expert web report to help assess possible slow breathing. These do not directly measure respiratory rate and do not constitute separate respiratory diagnostics or additional HRV metrics.

f peakPeak frequency of the respiratory heuristic
Hz
P peakPeak power of the respiratory heuristic
s²
P band meanMean band power of the respiratory heuristic
s²
P windowWindow power of the respiratory heuristic
s²
P LF checkLF power of the respiratory heuristic
s²
LF/HF checkLF/HF ratio of the respiratory heuristic
dimensionless

Reference group and recording conditions

In the detailed web report where documented and applicable to the recording. Missing recording conditions are not treated as known facts.

N referenceReference group size
count
N requiredMinimum required reference size
count
Age meanMean age of the reference group
years
Age SDAge standard deviation of the reference group
years
Male %Male proportion of the reference group
%
Female %Female proportion of the reference group
%
Reference selection criteria
descriptionsAge range, sex and time window used for reference selection.
Body position
description
Rest and activity context
description
Breathing conditions
description
Signal source and recording protocol
description
Medication, diabetes and rhythm context
descriptionsRecording context where documented; not automatically generated diagnoses.
Algorithm and reference versions
descriptionsExpert metadata on analysis, resampling, detrending and reference data.

Charts and result views

The views use the result data available for each recording route. The detailed Simple/Expert report is tied to the recording routes specified below.

ANS status diagram
Position describing autonomic regulation and balance; ARI complements it as the associated index.
RR tachogram
Original and analysed or corrected RR series with markers; Original, Corrected and Comparison views. Display in ms or as beatwise heart rate in bpm.
Poincaré plot
RRₙ against RRₙ₊₁ with SD1, SD2, their ratio and ellipse area; geometric view based on the available results.
Frequency spectrum
VLF, LF and HF bands with peak and band information. Switch between FFT power in ms², FFT amplitude in ms and power spectral density (PSD) in ms²/Hz.
RR histogram
Frequency distribution of RR intervals with triangular index; TINN using the implemented legacy method in the Expert web report. A suitable TINN overlay depends on the result.
Artefact and quality views
Marked and actually modified intervals, processing information and quality warnings. Original and analysis series remain distinguishable.
Longitudinal measurement comparison
Metric trends with date-range selection and filters for comparability, body position, breathing, protocol, quality and artefact load. TINN and peak amplitudes are not selectable trend parameters.
Simple/Expert web report
Accessible interpretation in Simple; detailed metrics, references and processing in Expert. The view depth is not a separate Medical licence. Recording routes and report language are specified below.

Recording and import options; report formats

BLE RR recording
Recording RR intervals using suitable BLE sensors supported by the application.
ATF import
Import of ATF V2.0. The detailed web report requires an associated, suitable recording context.
Detailed web report
For BLE RR and ATF with a suitable recording context and usable result. Simple and Expert with charts and explanations; this report generation is currently provided in German.
Classic PDF profile
German and English. Available when the application catalogue assigns the profile to the product in use and the particular analysis result meets the profile requirements.
Essential PDF profile
English. Also subject to product assignment in the application and eligibility of the particular analysis result.

Classic and Essential are separate PDF profiles. They are not a complete PDF export of the detailed Simple/Expert web report; assignment and selection take place in the application.

Edition-specific features

Private person and family profiles
Assign recordings and results to the respective person.
Person-specific measurement history
Review personal and family measurement series over time.
Results and comparisons
Revisit stored results and compare recordings in their documented context.
Medical – Parameters, charts & features

Technical overview · scroll vertically

Calculated metrics

Time domain · 7 metrics

SDRRStandard deviation of RR intervals
ms
RMSSDRoot mean square of successive RR differences
ms
NN50Number of successive RR differences exceeding 50 ms
count
pNN50Proportion of successive RR differences exceeding 50 ms
%
CVCoefficient of variation of RR intervals
%SDRR relative to mean RR, scaled by 100.
MASDMean absolute successive RR difference
msAlso called absolute sinus arrhythmia; counted once.
rRRLag-1 correlation of successive RR intervals
dimensionless

Frequency domain · 18 metrics

Peak frequencies identify band maxima; they are not directly measured respiratory rates.

VLFVLF band power
ms²
LFLF band power
ms²
HFHF band power
ms²
TPTotal power according to the analysis profile
ms²Summed over defined bands or the full spectrum, according to the profile.
VLF %Relative VLF power
%
LF %Relative LF power
%
HF %Relative HF power
%
LFnuNormalised LF power
n.u. (0–100)Reference power: total power minus VLF.
HFnuNormalised HF power
n.u. (0–100)Reference power: total power minus VLF.
LF/HFLF-to-HF power ratio
dimensionless
VLF peak fVLF peak frequency
Hz
LF peak fLF peak frequency
Hz
HF peak fHF peak frequency
Hz
VLF peak AVLF peak amplitude
sIn the Expert web report; not selectable as a trend parameter. The spectrum chart can display amplitudes in ms.
LF peak ALF peak amplitude
sIn the Expert web report; not selectable as a trend parameter. The spectrum chart can display amplitudes in ms.
HF peak AHF peak amplitude
sIn the Expert web report; not selectable as a trend parameter. The spectrum chart can display amplitudes in ms.
SESpectral entropy using the implemented legacy method
method-specific; no unit specifiedUses unnormalised spectral power values in s² and the base-10 logarithm; neither sample entropy nor normalised Shannon entropy.
HCRHeart Coherence Ratio
dimensionlessRatio using the implemented method, based on a peak window and the remaining spectral power.

Geometric methods · 6 metrics

SD1Poincaré short-axis standard deviation
ms
SD2Poincaré long-axis standard deviation
ms
SD1/SD2Poincaré SD1/SD2 ratio
dimensionless
APoincaré ellipse area
ms²
TAITriangular index
dimensionlessRatio of interval count to the frequency of the modal bin.
TINNTINN using the implemented legacy method
msIn the Expert web report; not selectable as a trend parameter. A geometric overlay is not available for every result.

The following metrics belong to the shared calculation core. Complete Expert details are accessible in the detailed web report for suitable, context-bound ATF recordings. Telmed and EDF result views do not automatically contain all report fields. The 31 main metrics are available as trend parameters, with the explicitly marked exceptions of TINN and peak amplitudes. PDF profiles have their own output scope.

The 31 HRV metrics include derived measures. Transformations, reference percentiles, quality information, individual histogram bins and spectral points are not counted as additional metrics. Availability of individual values depends on the data source, analysis profile and usable recording.

Mathematically undefined or unusable measures remain unavailable; they are not replaced with zero. SDRR is not counted again as SDNN.

Four base measures and regulation index

Additional to the 31 HRV metrics; also selectable as trend parameters when results are available.

RR meanMean RR interval
ms
RR minMinimum RR interval
ms
RR maxMaximum RR interval
ms
HR meanMean heart rate
bpmCalculated as 60000 / mean RR interval in ms.
ARIAutonomic Regulation Index
% (index 0–100)Composite regulation index, not a percentage of health or a probability of disease.

Logarithmic outputs

Expert web report and selectable trend parameters, when a value is available for the recording.

ln(LF)Natural logarithm of LF power
no unitLogarithm of the numerical value in ms²; requires positive power.
ln(HF)Natural logarithm of HF power
no unitLogarithm of the numerical value in ms²; requires positive power.
ln(LF/HF)Natural logarithm of the LF/HF ratio
dimensionlessRequires a positive, defined ratio.

Reference percentiles · 16 outputs

Assigned to their respective metric in the Expert web report when a sufficient matching reference group exists. These are neither additional HRV metrics nor separately selectable trend curves. PDF outputs use their own profile selection.

PR VLFReference percentile for VLF band power
percentile (0–100)
PR LFReference percentile for LF band power
percentile (0–100)
PR HFReference percentile for HF band power
percentile (0–100)
PR VLF %Reference percentile for relative VLF power
percentile (0–100)
PR LF %Reference percentile for relative LF power
percentile (0–100)
PR HF %Reference percentile for relative HF power
percentile (0–100)
PR LFnuReference percentile for normalised LF power
percentile (0–100)
PR HFnuReference percentile for normalised HF power
percentile (0–100)
PR TPReference percentile for total power
percentile (0–100)
PR LF/HFReference percentile for LF/HF ratio
percentile (0–100)
PR RR meanReference percentile for mean RR interval
percentile (0–100)
PR HR meanReference percentile for mean heart rate
percentile (0–100)
PR SDRRReference percentile for SDRR
percentile (0–100)
PR RMSSDReference percentile for RMSSD
percentile (0–100)
PR ln(LF/HF)Reference percentile for ln(LF/HF)
percentile (0–100)
PR ARIReference percentile for ARI
percentile (0–100)

Analysis profile and histogram details

Additional Expert web report outputs describing the profile and histogram; not separate trend parameters.

VLF startLower evaluated VLF frequency
Hz
VLF endUpper evaluated VLF frequency
Hz
LF startLower evaluated LF frequency
Hz
LF endUpper evaluated LF frequency
Hz
HF startLower evaluated HF frequency
Hz
HF endUpper evaluated HF frequency
Hz
N unassignedIntervals not assigned to legacy histogram bins
count
N modalFrequency of the modal legacy histogram bin
count

Recording duration, processing and quality

Available according to the recording route in result quality, the RR view and the detailed web report. Protocol duration, the signal quality index and the heart-rate check belong to the detailed web report. Not every supplementary value is a trend parameter.

T recordingActual interval coverage of the original recording
s
T analysisDuration of the analysed RR series
ms
T protocolNominal protocol duration
sSeparate from the actual recording duration.
N inputInput interval count
count
N analysisAnalysis interval count
count
N markedIntervals marked for processing
countMarked intervals are not necessarily values that were actually changed.
N modifiedInterval values actually modified
countIn the comparison of original and analysis series.
AFBProportion marked for correction
%Also available as a trend quality measure; not a confirmed error or rhythm diagnosis.
AFB limitApplied artefact warning threshold
%
QualityTechnical signal quality index
%Technical assessment; not the proportion of correctly measured heartbeats.
N fastNumber of fast intervals in the heart-rate check
count
Fast %Proportion of fast intervals in the heart-rate check
%
N checkedInterval count used for the heart-rate check
count
Artefact method and processing applied
description / statusProcessing information provided with the result, not a manual beat or artefact editor.
Quality warnings and suppressed interpretation
status / noticeIndicates when data quality limits the interpretative output.

Respiratory heuristic check values

Supplementary check values in the Expert web report to help assess possible slow breathing. These do not directly measure respiratory rate and do not constitute separate respiratory diagnostics or additional HRV metrics.

f peakPeak frequency of the respiratory heuristic
Hz
P peakPeak power of the respiratory heuristic
s²
P band meanMean band power of the respiratory heuristic
s²
P windowWindow power of the respiratory heuristic
s²
P LF checkLF power of the respiratory heuristic
s²
LF/HF checkLF/HF ratio of the respiratory heuristic
dimensionless

Reference group and recording conditions

In the detailed web report where documented and applicable to the recording. Missing recording conditions are not treated as known facts.

N referenceReference group size
count
N requiredMinimum required reference size
count
Age meanMean age of the reference group
years
Age SDAge standard deviation of the reference group
years
Male %Male proportion of the reference group
%
Female %Female proportion of the reference group
%
Reference selection criteria
descriptionsAge range, sex and time window used for reference selection.
Body position
description
Rest and activity context
description
Breathing conditions
description
Signal source and recording protocol
description
Medication, diabetes and rhythm context
descriptionsRecording context where documented; not automatically generated diagnoses.
Algorithm and reference versions
descriptionsExpert metadata on analysis, resampling, detrending and reference data.

Charts and result views

The views use the result data available for each recording route. The detailed Simple/Expert report is tied to the recording routes specified below.

ANS status diagram
Position describing autonomic regulation and balance; ARI complements it as the associated index.
RR tachogram
Original and analysed or corrected RR series with markers; Original, Corrected and Comparison views. Display in ms or as beatwise heart rate in bpm.
Poincaré plot
RRₙ against RRₙ₊₁ with SD1, SD2, their ratio and ellipse area; geometric view based on the available results.
Frequency spectrum
VLF, LF and HF bands with peak and band information. Switch between FFT power in ms², FFT amplitude in ms and power spectral density (PSD) in ms²/Hz.
RR histogram
Frequency distribution of RR intervals with triangular index; TINN using the implemented legacy method in the Expert web report. A suitable TINN overlay depends on the result.
Artefact and quality views
Marked and actually modified intervals, processing information and quality warnings. Original and analysis series remain distinguishable.
Longitudinal measurement comparison
Metric trends with date-range selection and filters for comparability, body position, breathing, protocol, quality and artefact load. TINN and peak amplitudes are not selectable trend parameters.
Simple/Expert web report
Accessible interpretation in Simple; detailed metrics, references and processing in Expert. The view depth is not a separate Medical licence. Recording routes and report language are specified below.
Live ECG
ECG display during a supported live recorder measurement.
Stored ECG view
For suitable stored Telmed raw data. Not a general viewer for EDF/EDF+ or arbitrary older import formats.

Recording and import options; report formats

ATF import
Import of ATF V2.0. The detailed web report requires an associated, suitable recording context.
EDF/EDF+ import
Import of suitable ECG channels for RR detection and short-term HRV analysis. Import alone does not provide a stored ECG view or the detailed web report.
Live recorder measurement
Recording with supported ECG recorders and the associated live ECG display.
Telmed / SD card import
Import of supported Telmed recordings from an SD card for analysis. Suitable raw data also support the stored ECG view.
Detailed web report
For context-bound ATF analyses with a suitable result. Telmed and EDF inputs use their result views; they do not automatically receive this detailed report. This report generation is currently provided in German.
Classic PDF profile
German and English. Available when the application catalogue assigns the profile to the product in use and the particular analysis result meets the profile requirements.
Essential PDF profile
English. Also subject to product assignment in the application and eligibility of the particular analysis result.

Classic and Essential are separate PDF profiles. They are not a complete PDF export of the detailed Simple/Expert web report; assignment and selection take place in the application.

Edition-specific features

Patient management
Organise patient profiles and their recordings, results and histories.
Medical history
Document structured medical history and patient context.
Manual diagnosis entries
Record a description, ICD entry and date for documentation; not automated diagnosis.
Contact and practice details
Manage patient contact details and practice information.
Documentation
Bring medical history, diagnosis entries and recording results together in the patient context.
Groups
Organise patients and access using the available groups.
Team roles
Assign administrator and user roles for collaboration.
Differentiated access
Control access to medical data according to roles and assigned groups.

ANS Explorer Personal

Available in a few days.

A clearer view of your health and wellbeing.

Get to know your body's regulation better with clearly explained HRV analyses.

Illustration of autonomic regulation with two blue points and an upward arrow. Axes: regulatory capacity and autonomic balance.
Illustrative example

ANS Explorer Medical will also be available for use in your practice or business from early 2027.